7th Jan, 2009 will be remembered in India as well around the financial world for one of biggest corporate scam exposed in India. Satyam Computer Services, the 4th biggest IT giant has revealed that they had been continously publishing fraudulent balance sheets over the last few years. The chairman Mr. Ramalinga Raju has resigned today and put forward a 5 page confession report. This has come as a blow to the FII and per say, all investor classes and they started punishing the market. Satyam was no doubt hammerred beyond repair, but it resulted in the hammering of all categories of stocks. Only Infosys and Wipro stood out in the green.
Now, I will come to technical analysis part, but first a review of my last post.......
"Now, the next resistance will come around 3178 on NF which is one of the peaks of the current wave. Supports will come at 3102 and 3063 on the downside. So long NF is above 3063, one should not go short. BUT, if NF closes below 3102 and then tries to fall below the declining line of 3060, then a short should be initiated. Otherwise, one should continue with longs at dips till its above 3063."
As posted, Nifty tanked 160 points below 3060 and rested on the blue dotted trend line (see the picture link given in earlier post). BUT, does it mean that todays 200 points slide was technically predicted. The amswer is NO and a BIG NO. If anyone ever said that, it will be a straigth away lie. Nifty is weak below 3060 but a fall of this magnitude in a day was purely sentiment driven. And same sentiment was playing in favor of Infosys which gained 2% on a day when its peers fell 10-12%. No technicals/fundamentals work on these days.
Now, study the given chart. I am explaining my views pictorially here....
http://i441.photobucket.com/albums/qq134/Saptarshi_m/Nifty%20Analysis/NiftyPossibleMovements-1.png
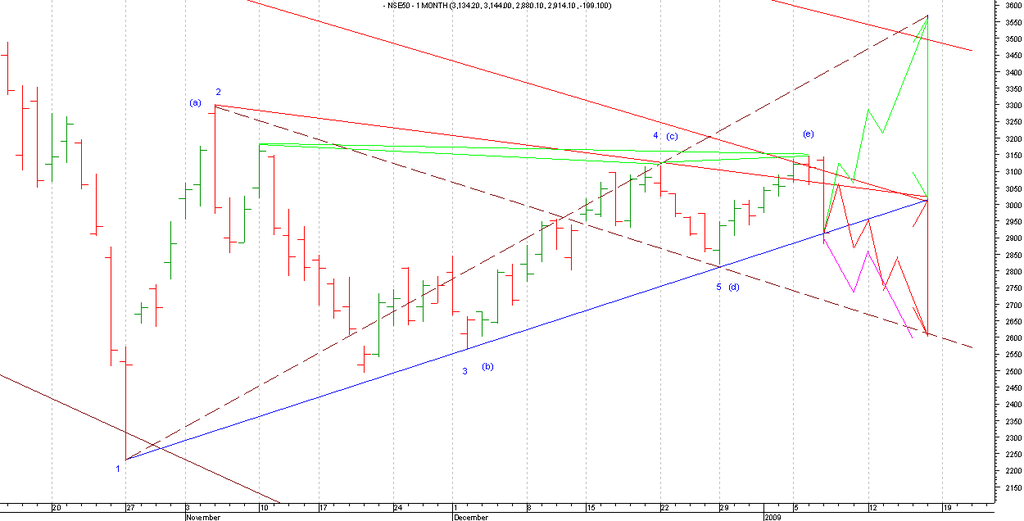
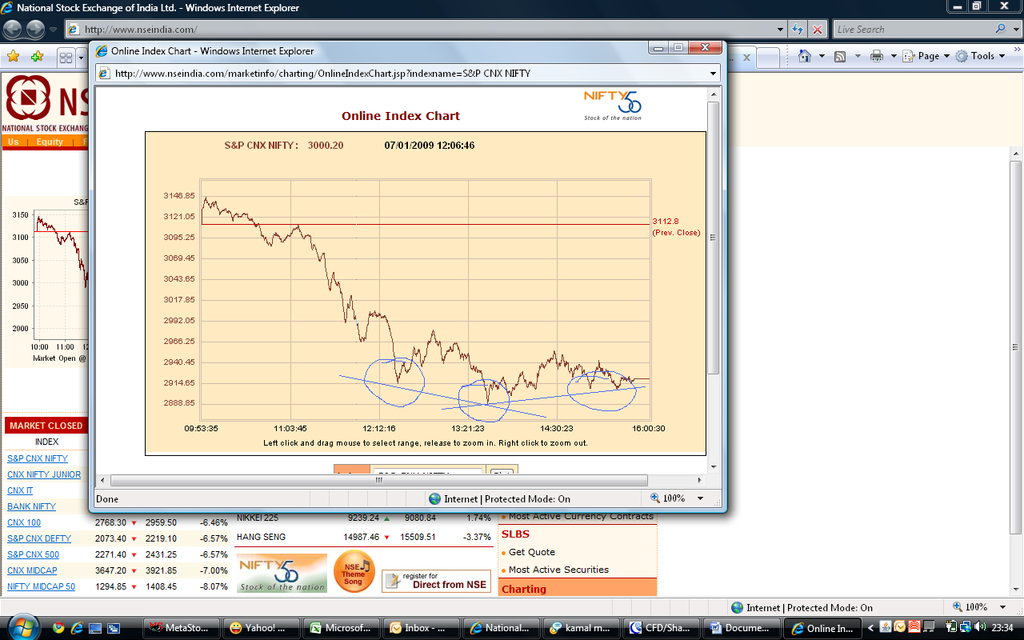
Todays fall was a panic driven one and closed exactly above the 2914 trend line support (see the deep blue line)...Around this level, Nifty made triple bottom today. See figure below....
http://i441.photobucket.com/albums/qq134/Saptarshi_m/Nifty%20Analysis/NiftyIntradayTripleBottomon7thJan20.png
http://i441.photobucket.com/albums/qq134/Saptarshi_m/Nifty%20Analysis/NiftyIntradayTripleBottomon7thJan20.png
Ideally, a triple bottom with a lowest middle trough, on a strong support trend line makes it very bullish. BUT, there are a few things to be noted. IF and ONLY IF, NF manages to stay above this level, we are going to see the new high soon and even a possible 3550 (suggested by wave 1-2-3-4-5 with its diagonals depicted by the deep brown line and the green motion lines). HOWEVER, IF NF fall below 2900, then we will see a rather deep cut to around 2550-2600 (suggested by the wave a-b-c-d-e with its diagonals depicted by the dotted brown line and the red/pink motion lines). So, again watch out for 2900 level which can turn the table in either way. Hence my advice would be to buy out-of-money calls and puts instead of stock futures.
[For details of our services, please write to us at psfinancials@yahoo.in or call us at 9433071980, 9314611288....For new demat/trading accounts with the best brokerage charges, mail us your details to psfinancials@in.com and our team will send you all documents through courier services. Do write us with your suggestions and comments].
[For details of our services, please write to us at psfinancials@yahoo.in or call us at 9433071980, 9314611288....For new demat/trading accounts with the best brokerage charges, mail us your details to psfinancials@in.com and our team will send you all documents through courier services. Do write us with your suggestions and comments].
No comments:
Post a Comment