What a fantastic battle we saw in the markets today!!!..Nifty tries to scale new highs till 13:00 hrs. Then comes the big hammering and Nifty falls like a pack of cards. I dont know how many dreamt of recovery at that moment. A panic prevailed.....an air of extreme nervousness blew through people's mind and heart. NF went to 3057 and was trading at a discount of 5 rs. I am trying to boast though many will try to point to that, but I had the courage to buy calls and go long at 3070. The obvious question is Why? And the reason was two: firstly the 5 min chart completed the wave diagonal at 3070 (explained in my earlier post) and secondly, I tried to play a mental game (explained in just my earlier post). A panic can never lead to a fall. A panic creates opportunity to go long thereby, trapping the shorts. Markets can never up or down vertically. Its needs to fall slowly or go up slowly.
Remember : The higher you throw a ball, the faster will it come down. Similarly, the harder you hit a ball on the ground, the faster will it bounce back.
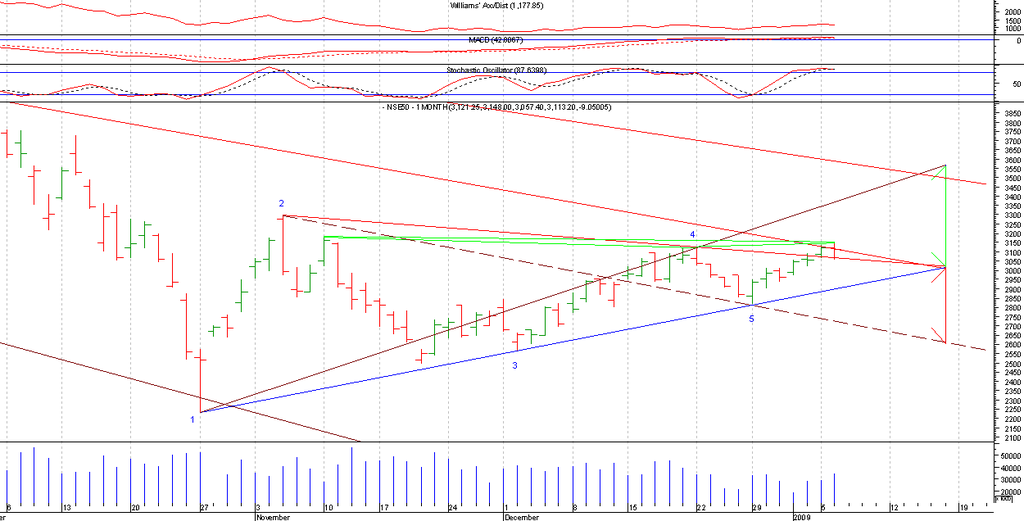
Now, NF closed above the resistance of the current wave for 2 consecutive days. Today, in fact, it closed even above the resistance of the previous wave (now I am referring to wave caused by movements on the daily chart). One interesting phenomenon that happened today was that, NF first crossed the previous wave then fell back on the current wave and finally took support above all resistance. Typically, resistances once crossed becomes support. When markets try to come out of bear phase or is in a bear rally, this type of movements is always seen. I had closely tracked the Dow 1929 movements on its log chart when it was coming out of bear phase though new highs were made 20 yrs later. A similar pattern is somewhat developing here though its too early to make any sure comments.
Now, the next resistance will come around 3178 on NF which is one of the peaks of the current wave. Supports will come at 3102 and 3063 on the downside. So long NF is above 3063, one should not go short. BUT, if NF closes below 3102 and then tries to fall below the declining line of 3060, then a short should be initiated. Otherwise, one should continue with longs at dips till its above 3063. Otherwise, the directions and levels as predicted by waves are explained on the charts clearly, both possible upside and downside.
http://i441.photobucket.com/albums/qq134/Saptarshi_m/Nifty%20Analysis/Niftyon6thJan2009.png
Remember : The higher you throw a ball, the faster will it come down. Similarly, the harder you hit a ball on the ground, the faster will it bounce back.
Now, NF closed above the resistance of the current wave for 2 consecutive days. Today, in fact, it closed even above the resistance of the previous wave (now I am referring to wave caused by movements on the daily chart). One interesting phenomenon that happened today was that, NF first crossed the previous wave then fell back on the current wave and finally took support above all resistance. Typically, resistances once crossed becomes support. When markets try to come out of bear phase or is in a bear rally, this type of movements is always seen. I had closely tracked the Dow 1929 movements on its log chart when it was coming out of bear phase though new highs were made 20 yrs later. A similar pattern is somewhat developing here though its too early to make any sure comments.
Now, the next resistance will come around 3178 on NF which is one of the peaks of the current wave. Supports will come at 3102 and 3063 on the downside. So long NF is above 3063, one should not go short. BUT, if NF closes below 3102 and then tries to fall below the declining line of 3060, then a short should be initiated. Otherwise, one should continue with longs at dips till its above 3063. Otherwise, the directions and levels as predicted by waves are explained on the charts clearly, both possible upside and downside.
http://i441.photobucket.com/albums/qq134/Saptarshi_m/Nifty%20Analysis/Niftyon6thJan2009.png
Out of the top 10 index movers, RIL, ICICI, ITC, Infy, Bhel showed very strong closing whereas, SBI, NTPC and Bharti showed weakness. Its true that a few of the indicators are showing overbought positions but the wave is not showing any signs of weakness on the NF charts. Under these circumstances, we should not hurry into any positional trades but rather play cautiously till the wave confirms a breakout on either sides.
[For details of our services, please write to us at psfinancials@yahoo.in or call at 9433071980, 9314611288....For new demat/trading accounts with the best brokerage charges, mail us your details to psfinancials@in.com and our team will send you all documents through courier services. Do write us with your suggestions and comments]
[For details of our services, please write to us at psfinancials@yahoo.in or call at 9433071980, 9314611288....For new demat/trading accounts with the best brokerage charges, mail us your details to psfinancials@in.com and our team will send you all documents through courier services. Do write us with your suggestions and comments]
No comments:
Post a Comment